Fire detections concentrated around Australia’s coastline, with localized high-intensity hotspots
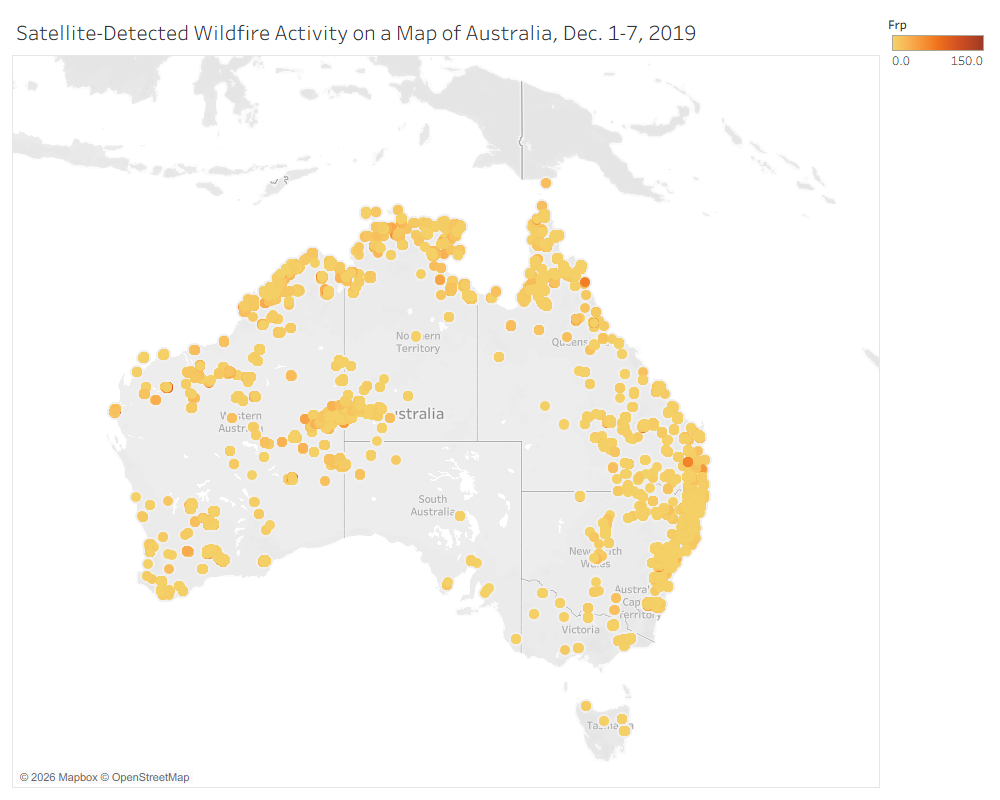
We mapped VIIRS active-fire detections over Australia between December 1st and December 7th, 2019, in order to investigate the spatial distribution of wildfire activity. Each dotted point represents a thermal outlier detected by satellite, while darker orange points indicate higher Fire Radiative Power, or FRP, measured in megawatts. The visualization shows that detections were geographically uneven, with broad concentrations around Australia’s coastal regions and fewer detections across much of the interior. Rather than being evenly distributed throughout all recorded fire activity, higher-FRP measurements emerged as concentrated hotspots.
Fire Intensity
The darkest points were concentrated in particular locations across the regions. This indicates that the highest FRP measurements occurred within the hotspots or the wider distribution of fire activity.
Spatial Pattern
A majority of the fire detections/hotspots formed around Australia’s coastal regions, especially along the eastern, southeastern, and northern regions. The specific locations that had the most fire activity include New South Wales, Victoria, Queensland, and the Northern Territory.
Limitation
Since satellite detections are the only thing pointed on the map, this labels unique fires, total area burned, or cumulative damage as a non-factor. Cloud cover and satellite detection thresholds may also cause some fire activity to be under- or over-counted.
What the Map Leaves Unseen
Satellite data recorded on the map can reveal thermal activity, but it cannot show which communities, plant populations, or ecosystems/habitats suffered the greatest consequences of the fire. Answering those questions requires additional demographic, ecological, historical, and firsthand sources.
Relationship between the number of scans and confidence
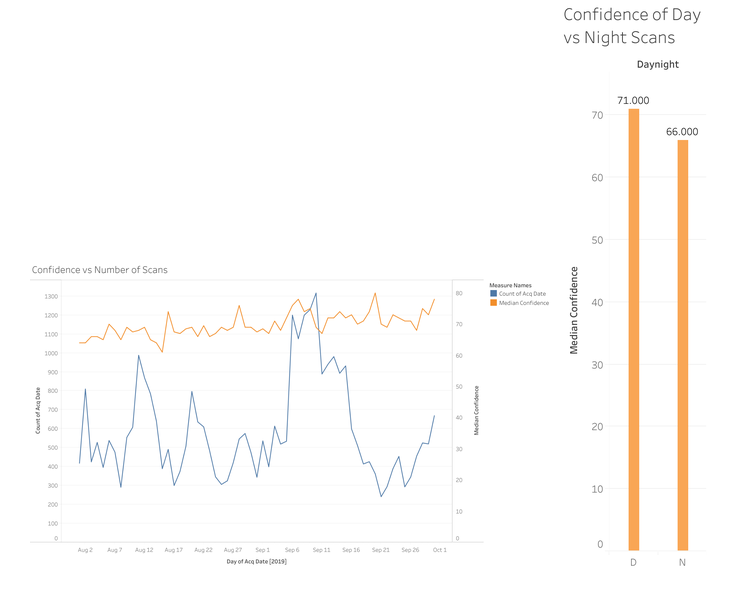
Further examining the factors that affect the confidence of scans, recognizing the relationship between the number of scans taken on a given date and the median confidence of those scans is important to understanding most efficient practices for monitoring future wildfires. The results of the graph show an interesting lack of a clear relationship between the number of scans taken and the median confidence of those scans. There is a general trend of increasing confidence over time; however, the statistical significance of this change is not a feature of this graph.
Missing Information
The information missing from this graph is just as important. There is no information on what regions these scans covered, for instance. Dates with a larger number of scans could cover a larger area or a very concentrated area, and there would be no clear indicator. However, it is clear that there is no evident relationship between the number of scans in a given day and the confidence in those scans. As a result, we can conclude at least a lack of utility in increasing the number of scans to raise the confidence in the results.
Implications for Future Monitoring
Individual scans do not seem to contribute to each other’s confidence. Therefore, confidence in the accuracy of a single scan cannot be bolstered by additional scans of the same region. Improving the confidence of future satellite imaging then cannot take the form of sheer volume but rather separate methods to make up for this lack of relationship.
How Human and Plant Populations Shape—and Are Shaped by—Wildfires
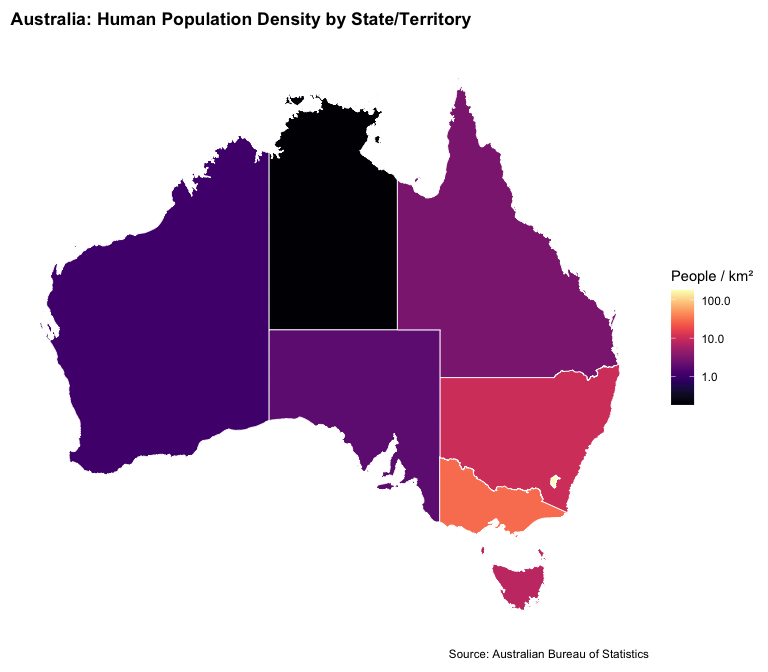
Going into our third finding, we wanted to investigate how human settlement and plant population density influenced the intensity of wildfires, which in return also influenced the migration of human settlement and vegetation concentrations across Australia.
The Effects of Plant Population on Wildfires
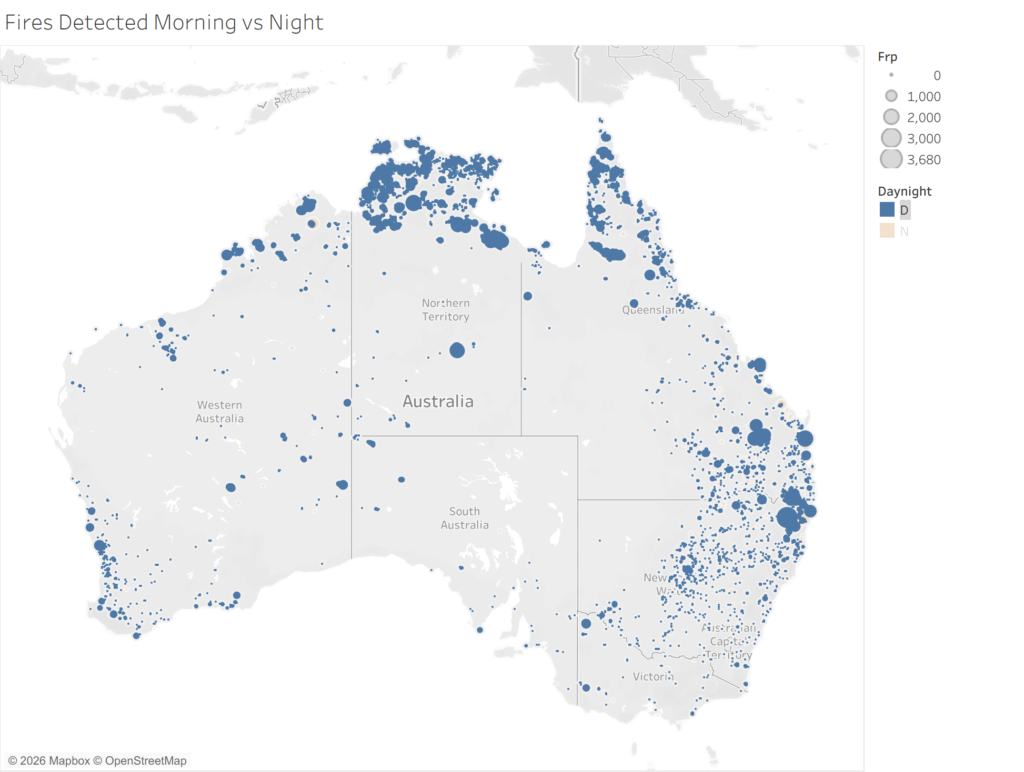
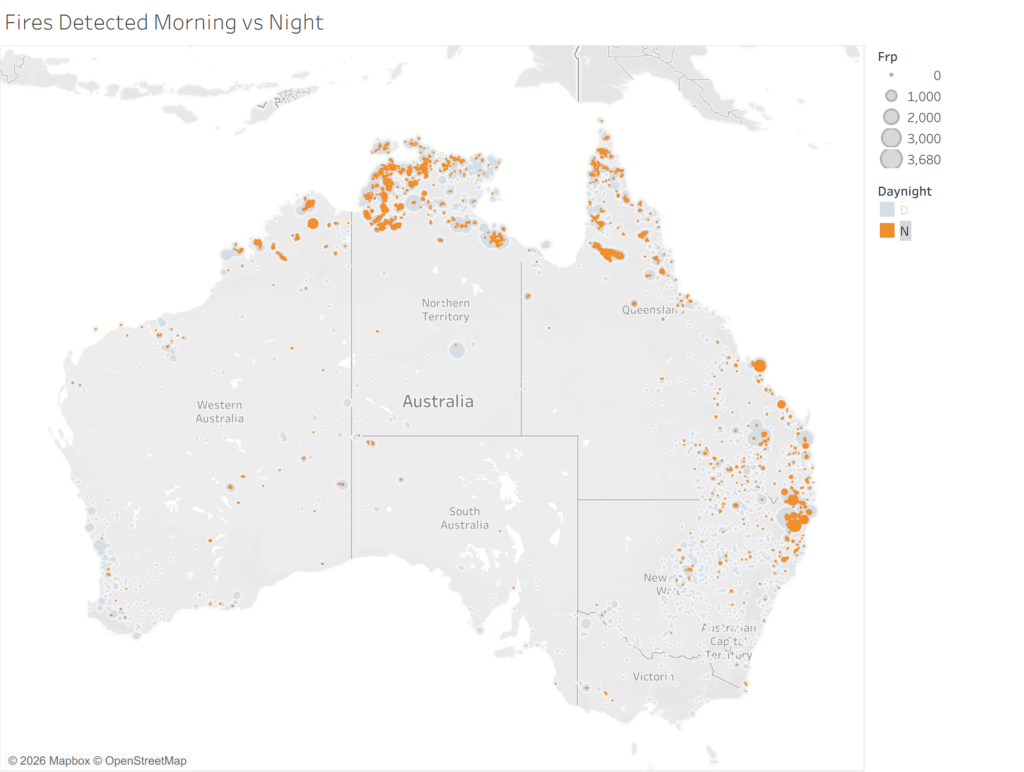
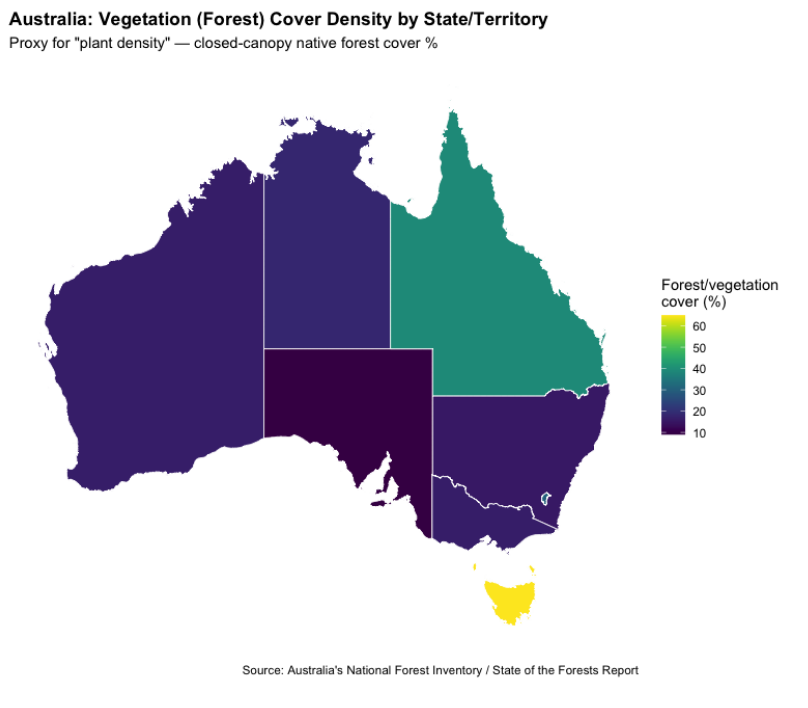
These maps illustrate the variation of fire activity across Australia during the 2019 to 2020 fires. Blue represents the number of fires detected by the MODIS and VIIRS satellites during the day, and orange represents the number of fires detected at night. Looking at both maps, we can clearly see a much higher frequency and distribution of fires detected during the day versus at night. This clearly reflects the weather cycles, as the higher temperatures, lower humidity, and daytime winds exacerbate fire behavior. The map of fires detected at night shows a much lower frequency of high-intensity fires due to cooler temperatures and higher humidity. Nevertheless, the night map still shows the presence of high-intensity fires that remain along the north and southeastern coast of Australia. According to Figure 7, although there is lower vegetation density in the Northern Territory and in New South Wales in comparison to Queensland, they are populated with savanna grasslands and eucalypt forests that provide dense fuel loads, especially during extreme droughts, that continue to fuel the catastrophic fires even at night. These maps are significant as they help us pinpoint and detect severe overnight fires and the risks they may pose to local communities and emergency services. According to the Cause and Consequences of Eastern Australia’s 2019-20 Season of Mega-Fires, “ from September/October onwards, estimated dead fuel moisture content was mostly below critical threshold values associated with the historical occurrence of large wildfires in south-eastern Australian forests (Nolan, Boer, et al., 2016).” This very much explains the persistence of high-intensity fires at night due to the collapse of typical nighttime weather recovery mechanisms as extreme fuel dryness allows fires to continue burning.
Human Wildfire Management
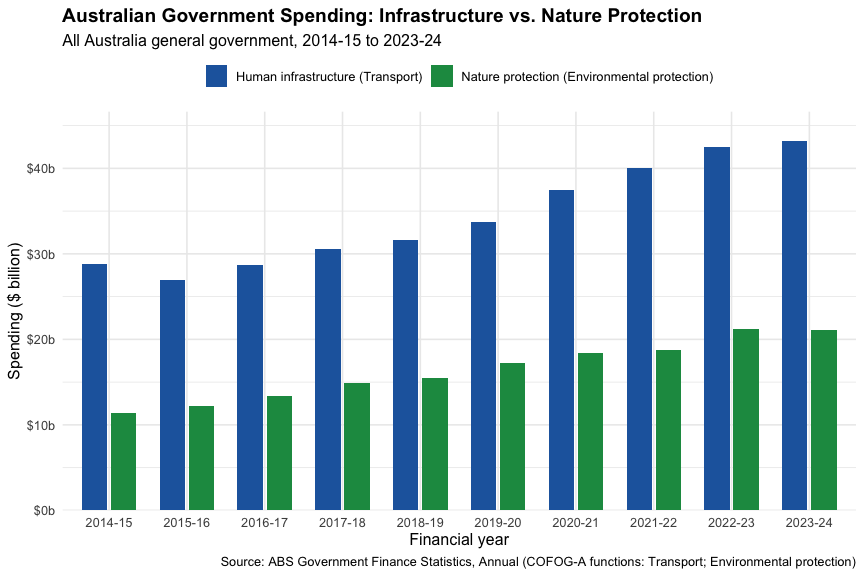
While it is evident that record-breaking temperatures, extreme rainfall deficits, and historic fire weather conditions fueled the catastrophic Black Summer fires, human choices are what heavily dictated wildfire behavior and outcomes. This disparity is often driven by institutional arrangements, as resources are often prioritized to wealthier areas with higher-value properties that also have professional firefighting services. On the other hand, poorer and more remote areas dense with nature have limited access to professional firefighting services and are forced to rely on local volunteers instead. Ultimately, the spatial layout of human development forces emergency services to prioritize infrastructure over natural biomes as the abstraction of wildfires into satellite data ignores various landscape variations, creating a blind spot that struggles to capture early-stage wildfire ignitions before it is detected by the satellite threshold. Looking at Figure 5, it can be seen that the Australian government’s spending on human infrastructure consistently and significantly outpaces the spending on environmental protection from 2014 to 2024. This drastic difference in budget directly illustrates the institutional prioritization of built environments over natural ecosystems.
Changes in Human Movement
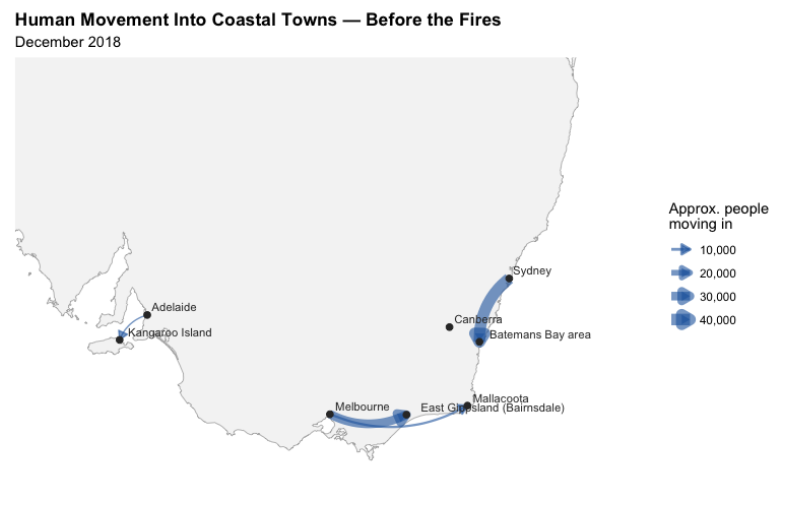
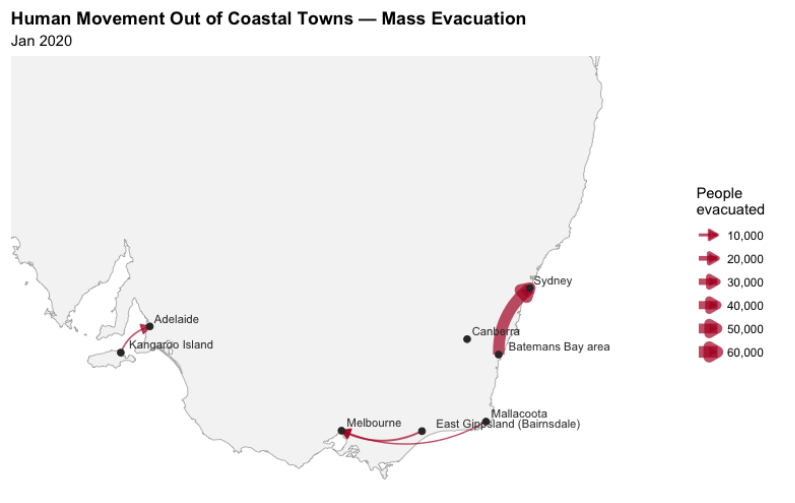
The two maps show migration patterns prior to and during the fires. In December of 2018, people were relocating from big cities to coastal communities including the Kangaroo Islands, Batemans Bay, Mallacoota, and East Gippsland. Many of these routes were being used in reverse by January of 2020 as people began to flee in the direction of larger cities. This shift demonstrates how bushfires interfered with normal travel and transformed coastal towns from well-liked tourist destinations into an evacuation zone. The larger arrow or evacuation flow from Batemans Bay to Sydney implies that the towns depicted were not equally affected by the fires.
Changes in Vegetation
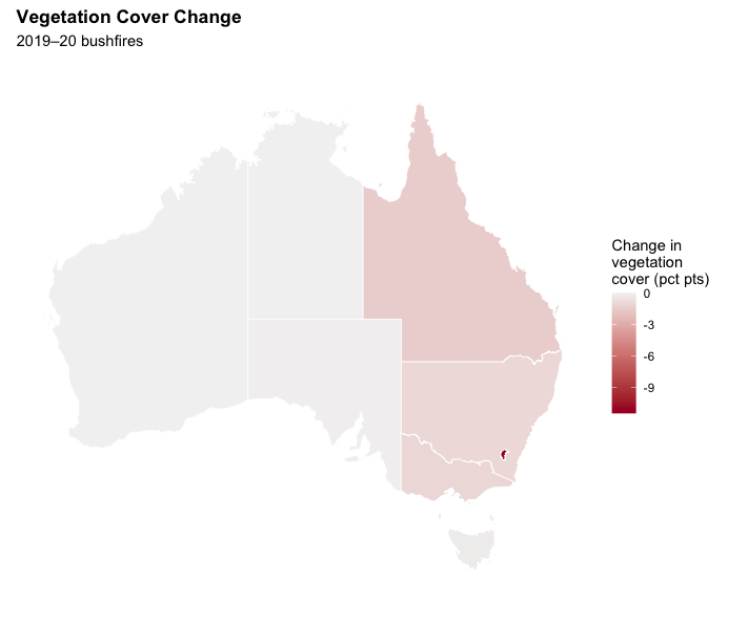
The two maps showcase the uneven distribution of vegetation across Australia and the regional variations during the 2019-2020 bushfires. The first map represents concentrated areas of vegetation by territory/state, while the second shows where the change of vegetation cover occurred during the bushfires. These maps suggest that plant populations were not equally affected. However, they do not represent the variation of ecosystems/habitats that were damaged by the fire.